Using a Music Festival Scenario
Provision the IBM Graph Service in Bluemix
Work with the Sample Dataset
IBM Graph Concepts
Load the Sample Dataset
Gremlin Query Language
Filter Steps
Transform Steps
Side Effect Steps
View Sample Queries
Create a Graph Database
Create a Model and Schema
Edge Labels
Vertex Labels
Property Keys
Obtain a GDS Token
Create the Initial Schema
Perform Basic Create-Read-Update-Delete Operations
Traverse Your Graph
Provision the IBM Graph Service in Bluemix
IBM Graph Concepts
Load the Sample Dataset
Gremlin Query Language
Filter Steps
Transform Steps
Side Effect Steps
View Sample Queries
Create a Model and Schema
Edge Labels
Vertex Labels
Property Keys
Obtain a GDS Token
Create the Initial Schema
Follow these steps to provision the IBM Graph service.
- Visit IBM Bluemix at https://console.eu-gb.bluemix.net/.
- If you don't have a Bluemix account, click Sign Up. Complete the fields on the form, and click Create Account.
- If you have a Bluemix account, click Log In. Provide your IBMid and password, and click Log In.
- In the top navigation bar, click Catalog.
- In the left navigator, under Services, check Data and Analytics.
- Click IBM Graph.
- Accept the default service, or provide a different name, and click Create. This brings you to the IBM Graph Bluemix Service Launch Page.
- Click Open. This opens the IBM Graph dashboard so you can work with your database instance.
Work with the Sample Dataset
Graph’s power will become immediately apparent when you're able to walk multiple steps into your graph. In order to truly understand that power, you'll need to load a robust dataset which includes many vertices and edges each with properties. IBM Graph includes a sample dataset that you can load from the dashboard.
IBM Graph Concepts
Watch this short two minute video that explains IBM Graph concepts.
Back to topLoad the Sample Dataset
Follow these steps to load the sample dataset in your IBM Graph instance.
- First orient yourself to the Graph interface by walking through the Learn the Interface cards in the IBM Graph dashboard.
- Next, click Samples in the side navigator.
- On the Samples slide-out panel, next to Music Festival, click Load. The file will be added to the File Queue.
- Close the Samples panel.
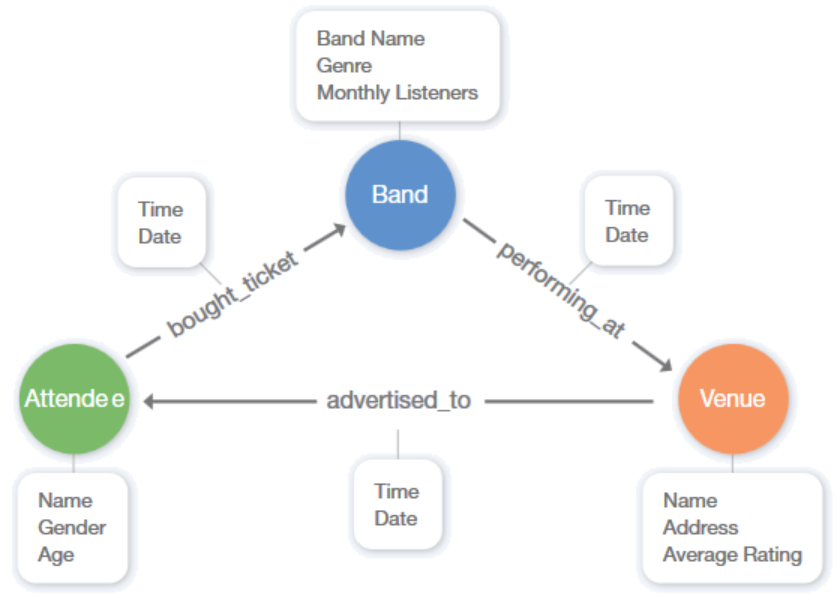
The following image illustrates the schema for the sample dataset which includes three vertices named attendee, band, and venue, and three edges named bought_ticket, performing_at, and advertised_to. Each of these elements contains properties.
 Back to top
Gremlin Query Language
Gremlin is the graph traversal language used in IBM Graph which allows you to query, analyze, and manipulate your graph data. Gremlin contains over 40 traversal step types, but for many use cases, only the more basic steps are necessary. Steps fall into three categories: transform, filter, and side effect. We'll look at the most commonly used traversal step types by executing a few example queries.
 Back to top
Filter Steps
Filter steps decide whether to allow an object to pass to the next step. Execute the following queries in the Query Builder.
- Has: This query removes every object that does not have the name "Porches".
- HasLabel: This query removes every object that does not have the label "attendee" and the name "Jane Doe".
def gt = graph.traversal();

gt.V().has('name', 'Porches')
def gt = graph.traversal();

gt.V().hasLabel('attendee').has('name', 'Jane Doe')
Transform Steps
Transform steps take an object and emit a transformation of it, for example, in, out, and both. Execute these queries in the Query Builder.
- In: This query uses "in" and returns all attendees who will see the band Porches perform.
- inE and outV: This query uses "inE" and "outV" and returns all attendees who bought a ticket to see a pop band. Notice that adding "path()" to the end of the query shows you how all of the vertices are connected.
- out: This query uses "out" and returns the bands that Laura Quinn has purchased tickets to see.
- outE and inV: This query uses "outE" and "inV" and returns all of the venues the band Porches is performing at.
- both: This query uses "both" and returns both the attendees and venues associated with the band Porches.
- bothE and bothV: This query uses "bothE" and "bothV" and returns both the attendees who have bought tickets to the band Porches and the venues where Porches is performing.
def gt = graph.traversal();

gt.V().has('name', 'Porches').in()
def gt = graph.traversal();

gt.V().has('genre', 'pop').inE('bought_ticket').outV().path()
def gt = graph.traversal();

gt.V().has('name', 'Laura Quinn').out().values('name')
def gt = graph.traversal();

gt.V().has('name', 'Porches').outE('performing_at').inV()
def gt = graph.traversal();

gt.V().has('name', 'Porches').both()
def gt = graph.traversal();

gt.V().has('name', 'Porches').bothE('bought_ticket','performing_at').bothV()
Side Effect Steps
Side Effect steps pass the object and results in a side effect. For example, to return the next object in the traversal step or to iterate through all objects in the traversal. Execute these queries in the Query Builder.
- next: The last query returned four attendees, a venue, and a band. Using .next, you can request the next two objects, in this case, an attendee and a band.
- hasNext: This query uses hasNext which returns true if there are more objects in the traversal.
def gt = graph.traversal();

gt.V().has('name', 'Porches').bothE().bothV().next(2)
def gt = graph.traversal();

gt.V().has('name', 'Porches').bothE().bothV().hasNext()
View Sample Queries
The dashboard includes some sample queries that will help you further see how to build queries for the dataset.
- Click Samples in the side navigator.
- Click See Sample Queries Card.
- Close the Samples slide-out panel.
- View each of the sample queries to see more examples of how you can query the dataset.
Create a Graph Database
Now that you have worked with the sample Graph database, it's time to build your own database. When you provisioned the service, IBM Graph creates an empty graph database for you named "g". But you can create other graph database in this same IBM Graph instance. Follow these steps to create another graph database.
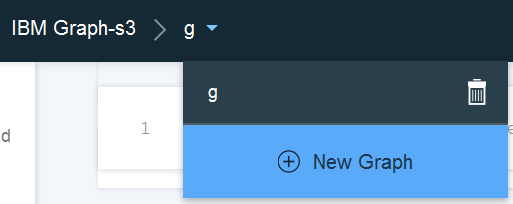
- Click the down-arrow in the Graph Manager as shown in the following figure:
- Click New Graph.
- Type
my-new-graph, and click the plus sign.
Create a Model and Schema
While the API documentation provides thorough technical details, this tutorial highlights the basic concepts surrounding data modeling and schema.
The schema is essentially a formal blueprint of the database and describes any data elements that you'll want to add to the database. The scenario used as the basis for the dataset is a music festival. When you're just starting out to define a model for your graph database, you need to understand and write out all the entities and relationships. At this festival:
- Bands perform at venues.
- Venues advertise to attendees.
- Attendees buy tickets to a band performance.
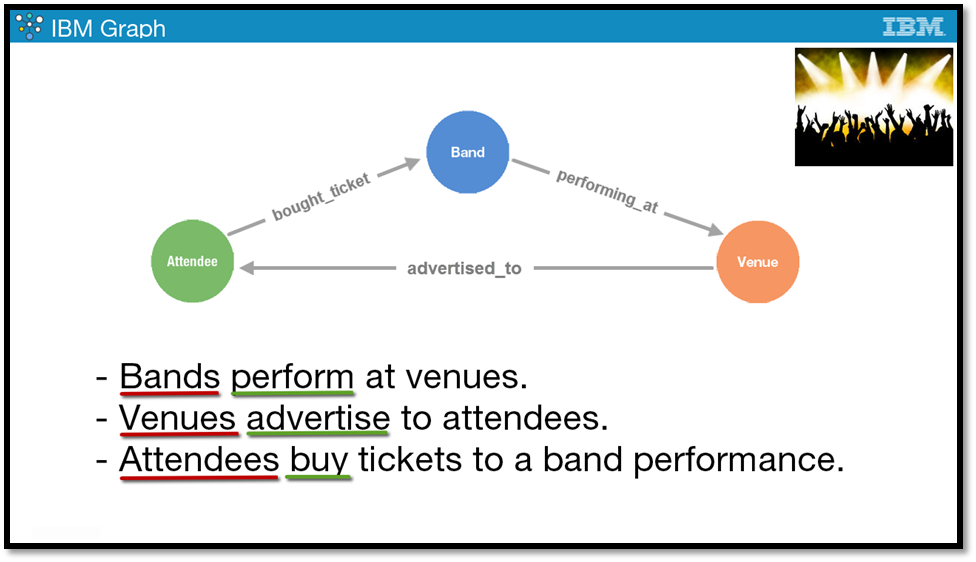
Notice that all of the nouns in the above sentences will represent vertices, and all of the verbs will represent edges. The natural conceptual model that a graph database provides helps you to understand and interpret your dataset in a more organic manner. You won’t start with all of these data elements at once. You'll start small with a single data element, and build it out from there.
The rest of the tutorial sections focus on developing and querying the dataset, and you'll see the impact that development has on the schema. Schema elements cannot be changed once created, however they can be extended after initial creation. The reason for this is that you might break existing data by making changes to element properties on that particular data type. As a result, if you wanted to change the values for your existing model, you would need to create a new database with a new schema, and then migrate. Let's take a closer look at some of the properties.
Back to topEdge Labels
Edge labels are required and define the semantics of the relationship. You may only have one label per edge.
To define an edge label, you need to provide a name as the unique string to distinguish the relationships. In this example, the edge label name is bought_ticket.
curl -X 'POST'

-d '{ "edgeLabels": [{"name": "bought_ticket", "multiplicity": "SIMPLE"}]}'

-H 'content-type: application/json'

-H 'authorization: gds-token [gds-token]' [apiURL]/schema
You also need to specify the multiplicity which defines the constraints of the relationship. The following table describes each of the five multiplicity types.
| Multiplicity | Example |
|---|---|
| MULTI allows multiple edges of the same label between any pair of vertices. | 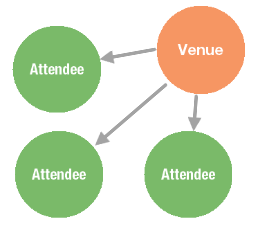 |
| SIMPLE allows at most one edge of a label between any pair of vertices. | 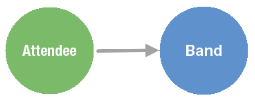 |
| MANY2ONE allows at most one outgoing edge of a label on any vertex in the graph but places no constraint on incoming edges. | 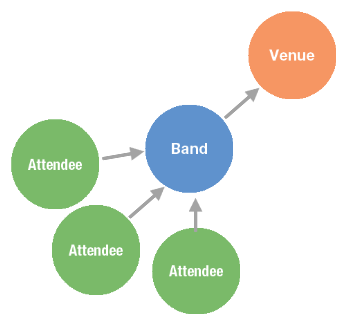 |
| ONE2MANY allows at most one incoming edge of a label on any vertex in the graph but places no constraint on outgoing edges. | 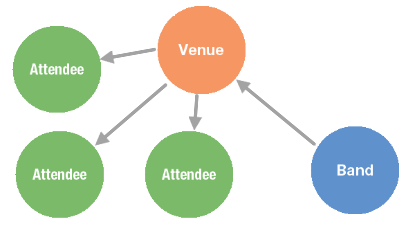 |
| ONE2ONE allows at most one incoming and one outgoing edge of a label on any vertex in the graph. | 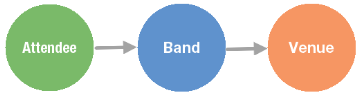 |
Vertex Labels
Vertex labels are optional and used to distinguish different vertex types. In this example, the vertex label is attendee.
curl -X 'POST'

-d '{ "propertyKeys":

[{"name": "name", "dataType": "String", "cardinality": "SINGLE"}, {"name": "gender", "dataType": "String", "cardinality": "SINGLE"}, {"name": "age", "dataType": "Integer", "cardinality": "SINGLE"}],

"vertexLabels": [{"name": "attendee"}], "vertexIndexes": [{"name": "vByName", "propertyKeys": ["name"], "composite": true, "unique": true}, {"name": "vByGender", "propertyKeys": ["gender"], "composite": true, "unique": false}]}'

-H 'content-type: application/json'

-H 'authorization: gds-token [gds-token]' [apiURL]/schema
Back to top
Property Keys
Property keys are immutable property types for both vertices and edges as key-value pairs.
The first property in the following example, is the name property which is a unique string to distinguish the name, gender, and age properties for the attendee vertex.
Next, the datatype property defines the datatype as integer, Boolean, float, or string.
Lastly, the cardinality property defines the number of allowed values associated with the key on any given vertex. The cardinality is defined as single, list, or set.
curl -X 'POST'

-d '{

	"propertyKeys": [{
		"name": "name",
		"dataType": "String",
		"cardinality": "SINGLE"
	}, {
		"name": "gender",
		"dataType": "String",<
		"cardinality": "SINGLE"
	}, {
		"name": "age",
		"dataType": "Integer",
		"cardinality": "SINGLE"
	}],
	"vertexLabels": [{
		"name": "attendee"
	}],
	"vertexIndexes": [{
		"name": "vByName",
		"propertyKeys": ["name"],
		"composite": true,
		"unique": false
	}, {
		"name": "vByGender",
		"propertyKeys": ["gender"],
		"composite": true,
		"unique": false
	}]
}'

-H 'content-type: application/json'

-H 'authorization: gds-token [gds-token]' [apiURL]/schema
Back to top
Obtain a GDS Token
You'll notice that all of the code examples so far include a session ID, or gds token, and apiURL. Follow these steps to obtain this information.
Important: Pay special attention to steps 2 and 8 where you will paste your credentials, and steps 3 and 9 where you will click the Update button to update the subsequent commands in this tutorial.
- From the IBM Graph Bluemix Service Page, click Service Credentials in the left navigator.
- Paste the values for your API URL, User Name, and Password inside the following fields.
- Paste your apiURL:
- Paste your user name:
- Paste your password:
- Click this button to update the commands in this tutorial.
- Open a Unix shell terminal window (native on MacOS, and additional install on Windows with a program such as Cygwin - be sure to install curl, bash, and jq).
- You can use the session API along with your username and password to generate a unique token that you then use for authentication in subsequent requests. Execute the following command.
- When prompted, type your password.
- You'll receive a response that looks similar to this which is your unique token that you then use for authnetication in subsequent requests. The token is in highlighted in green below.
- Paste just the GDS token part here:
- Click this button to update the commands for the rest of this tutorial.
Note: The command will display after clicking the button here.
{"gds-token": "ZjFmYjIwN2QtZjc5Zi00Zjg1LThiNWUtODkyMDQ0MWE4NzgwOjE0NjU0MTk1NDIyNzI6ZWJhdlRacytXY2VTeHNHaWlFUlY0MVVBK0FRQ1JtMXNQdVg0WlA0WUw0ST0="}
Create the Initial Schema
Let’s now create the initial schema for the music festival dataset to contain the attendee vertex with properties name, gender, and age. Since the propertyKeys field specifies the attributes you'd like the vertices to have, in this scenario, this is where the name, gender, and age properties will go for the attendee. The vertexLabel specifies that this is an attendee. The propertyKeys field creates indexes on each of the data element's properties which you'll later use to query the data.
curl -X POST -d '{
	"propertyKeys": [{
		"name": "name",
		"dataType": "String",
		"cardinality": "SINGLE"
	}, {
		"name": "gender",
		"dataType": "String",
		"cardinality": "SINGLE"
	}, {
		"name": "age",
		"dataType": "Integer",
		"cardinality": "SINGLE"
	}],
	"vertexLabels": [{
		"name": "attendee"
	}],
	"vertexIndexes": [{
		"name": "vByName",
		"propertyKeys": ["name"],
		"composite": true,
		"unique": true
	}, {
		"name": "vByGender",
		"propertyKeys": ["gender"],
		"composite": true,
		"unique": false
	}]
}'

-H 'content-type: application/json'

-H 'authorization: gds-token [your-gds-token]' [your-apiURL]/schema
Follow these steps to create the initial schema.
- At the command line, execute the following command using the gds-token obtained in the last procedure, and your API URL including "/g" for the rest of the procedures in this tutorial.
- The response looks similar to the text highlighted in red, green, and blue in the previous example.
Note: The command will display after clicking the button here.
Perform Basic Create-Read-Update-Delete Operations
In this section, you'll create, read, update, and delete some basic graph data elements, and establish a relationship between two vertices.
Create a Vertex
In IBM Graph, the first phase is to populate the database instance with data that you'll query against later. The first data elements in this scenario are two vertices, both labelled as an attendee, and distinguished from each other by having unique IDs. Each vertex also has some properties, consisting of the name, gender, and age.
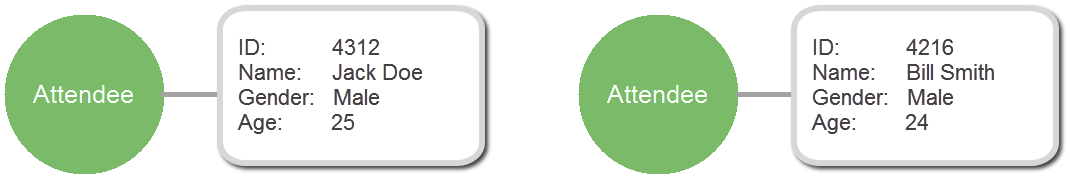
In the last section, you created the schema. Follow these steps to create two attendee vertices for Jack Doe and Bill Smith.
You'll notice that all of the code examples so far include a session ID, or gds token, and apiURL. Follow these steps to obtain this information.
Important: Pay special attention to steps 2 and 4 where you will paste the IDs for each new vertex, and step 5 where you will click the Update button to update the subsequent commands in this tutorial.
- At the command line, execute the following command using the gds-token obtained previously, and your API URL to create the vertex for Jack Doe.
- The response looks similar to the following, and includes an auto-generated ID for the vertex. You'll be using that ID later, so paste the ID for Jack Doe here:
- Execute the following command using the gds-token obtained previously, and your API URL to create the vertex for Bill Smith.
- The response looks similar to the response shown in step 3. You'll be using that ID later, so paste the ID for Bill Smith here:
- Click this button to update the commands with Jack's and Bill's IDs.
Note: The command will display after clicking the button here.
{
	"requestId": "bda1a986-7a96-4f14-aae2-da03baebede4",
	"status": {
		"message": "",
		"code": 200,
		"attributes": {}
	},
	"result": {
		"data": [{
			"id": 4312,
			"label": "attendee",
			"type": "vertex",
			"properties": {
				"gender": [{
					"id": "171-38o-1l1",
					"value": "Male"
				}],
				"name": [{
					"id": "1zh-38o-sl",
					"value": "Jack Doe"
				}],
				"age": [{
					"id": "1l9-38o-2dh",
					"value": 25
				}]
			}
		}],
		"meta": {}
	}
}
Note: The command will display after clicking the button here.
Read a Vertex
To read a vertex back, you'll use a simple gremlin query. You'll learn more about gremlin later in this tutorial, so for now, follow these steps to read back the vertex.
- At the command line, execute the following command using the gds-token obtained previously, and your API URL.
- The response will look similar to this:
Note: The command will display after clicking the button here.
{
	"requestId": "13f31ac0-7b46-48c2-b9ed-99f29e2b67b4",
	"status": {
		"message": "",
		"code": 200,
		"attributes": {}
	},
	"result": {
		"data": [{
			"id": 4312,
			"label": "attendee",
			"type": "vertex",
			"properties": {
				"gender": [{
					"id": "odxcr-3bs-1l1",
					"value": "Male"
				}],
				"name": [{
					"id": "ody57-3bs-sl",
					"value": "Jack Doe"
				}],
				"age": [{
					"id": "odxqz-3bs-2dh",
					"value": 25
				}]
			}
		}],
		"meta": {}
	}
}
Update a Vertex
So, now you know how to create and read a vertex. You will also need to be able to update the vertex, for example, to change Jack Doe's age. You need to specify the vertex ID along with the data for the vertex - both the data that will change as well as the data that will remain the same.
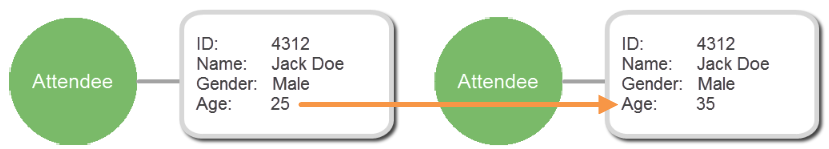
Follow these steps to update Jack Doe's age from 25 to 35.
- At the command line, execute the following command using the gds-token obtained previously, your API URL, and the vertex ID for Jack Doe that you noted when you created the vertex.
- The response will look something like this:
Note: This command will display after clicking the button here.
{

	"requestId": "07dbdd03-de7d-4a97-b3e1-cc6cca33cdcd",
	"status": {
		"message": "",
		"code": 200,
		"attributes": {}
	},
	"result": {
		"data": [{
			"id": 4312,
			"label": "attendee",
			"type": "vertex",
			"properties": {
				"gender": [{
					"id": "2dp-38o-1l1",
					"value": "Male"
				}],
				"name": [{
					"id": "365-38o-sl",
					"value": "Jack Doe"
				}],
				"age": [{
					"id": "2rx-38o-2dh",
					"value": 35
				}]
			}
		}],
		"meta": {}
	}
}
Delete a Vertex
Like updating a vertex, to delete you also need to include the vertex ID. Follow these steps to delete a vertex.
- At the command line, execute the following command using the gds-token obtained previously, your API URL, and the vertex ID for Bill Smith that you noted when you created the vertex.
- The response will look something like this:
Note: This command will display after clicking the button here.
{

	"requestId": "6672fc8f-ef32-46d2-aaf1-e4a78fdb9ac3",
	"status": {
		"message": "",
		"code": 200,
		"attributes": {}
	},
	"result": {
		"data": [true],
		"meta": {}
	}
}
Extend the Schema
You now know how to perform basic CRUD operations on a single vertex, but it’s highly unlikely that your graph dataset will be this simple. Graph is about gaining insight by exploring relationships, so next you'll create another attendee vertex and a band vertex, and then direct a bought_ticket edge from this person to the band they purchased a ticket to see.
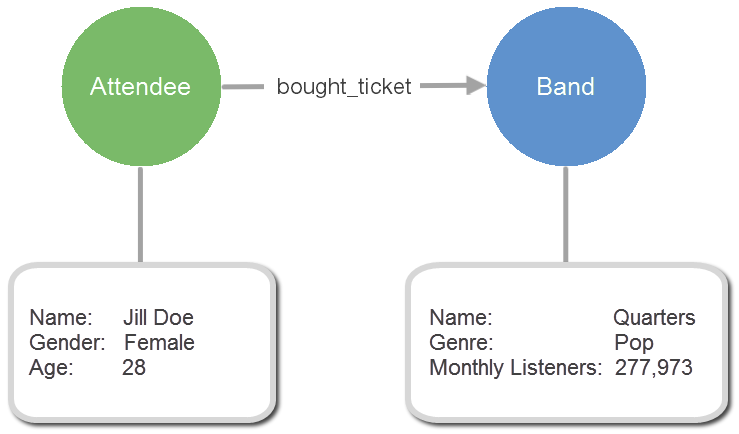
So, you'll need to extend the schema to include a new vertex for the band which will have properties consisting of the name, genre, and number of monthly listeners. Since the name property was defined with the initial schema, only the genre and monthly listeners are included in this schema extension. The schema also needs to define the bought_ticket edge.
{

	"propertyKeys": [{
		"name": "genre",
		"dataType": "String",
		"cardinality": "SINGLE"
	}, {
		"name": "monthly_listeners",
		"dataType": "String",
		"cardinality": "SINGLE"
	}],
	"vertexLabels": [{
		"name": "band"
	}],
	"edgeLabels": [{
		"name": "bought_ticket",
		"multiplicity": "SIMPLE"
	}],
	"vertexIndexes": [{
		"name": "vByGenre",
		"propertyKeys": ["genre"],
		"composite": true,
		"unique": false
	}]
}
Follow these steps to extend the schema, add the new vertices, and connect them with the new edge.
- At the command line, execute the following command using the gds-token obtained previously and your API URL that you noted when you created the vertex.
- The response will look something like this:
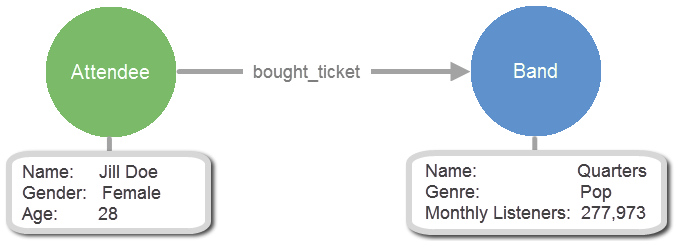
- Now, using Gremlin, you can create a new attendee with the name Jill Doe, band vertex with the name Quarters, and connect them with the new edge named bought_ticket. The following Gremlin query uses "addVertex" to create the two vertices, and "addEdge" to connect them with the edge.
- The response will look something like this:
Note: The command will display after clicking the button here.
{

	"requestId": "3f1e241c-4cfe-4b9f-aa6d-fdd24efadf51",
	"status": {
		"message": "",
		"code": 200,
		"attributes": {}
	},
	"result": {
		"data": [{
			"propertyKeys": [{
				"name": "genre",
				"dataType": "String",
				"cardinality": "SINGLE"
			}, {
				"name": "monthly_listeners",
				"dataType": "String",
				"cardinality": "SINGLE"
			}, {
				"name": "name",
				"dataType": "String",
				"cardinality": "SINGLE"
			}, {
				"name": "gender",
				"dataType": "String",
				"cardinality": "SINGLE"
			}, {
				"name": "age",
				"dataType": "Integer",
				"cardinality": "SINGLE"
			}],
			"vertexLabels": [{
				"name": "band"
			}, {
				"name": "attendee"
			}],
			"edgeLabels": [{
				"name": "bought_ticket",
				"directed": true,
				"multiplicity": "SIMPLE"
			}],
			"vertexIndexes": [{
				"name": "vByGenre",
				"composite": true,
				"unique": false,
				"propertyKeys": ["genre"],
				"requiresReindex": false,
				"type": "vertex"
			}, {
				"name": "vByName",
				"composite": true,
				"unique": true,
				"propertyKeys": ["name"],
				"requiresReindex": false,
				"type": "vertex"
			}, {
				"name": "vByGender",
				"composite": true,
				"unique": false,
				"propertyKeys": ["gender"],
				"requiresReindex": false,
				"type": "vertex"
			}],
			"edgeIndexes": []
		}],
		"meta": {}
	}
}
{

"gremlin": "
  def v1 = graph.addVertex("name", "Jill Doe", label, "attendee", "age", 28, "gender ", "female");
  def v2 = graph.addVertex("name", "Quarters", label, "band", "genre", "pop", "monthly_listeners", "277973");
  v1.addEdge("bought_ticket", v2)"
}
Execute the following command with your token and API URL.
Note: The command will display after clicking the button here.
{

	"requestId": "d4384095-b306-4cb5-8bda-a1763346fd40",
	"status": {
		"message": "",
		"code": 200,
		"attributes": {}
	},
	"result": {
		"data": [{
			"id": "2dl-37s-2a6t-oe06g",
			"label": "bought_ticket",
			"type": "edge",
			"inVLabel": "band",
			"outVLabel": "attendee",
			"inV": 40964200,
			"outV": 4168
		}],
		"meta": {}
	}
}
Traverse Your Graph
If your dataset contains thousands or millions of individual data elements, then the realm of possible relationships to explore is quite complex. The concept is simple, traversing between nodes through relationships to answer questions.
Build Queries
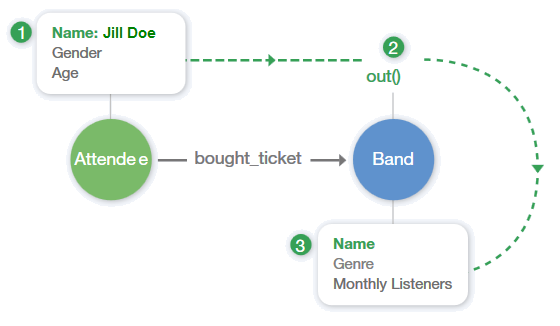
Your graph database contains a Jill Doe attendee, and Jill bought a ticket to see the band Quarters. You can build a simple query to find all of the bands that Jill has bought tickets to see.
Follow these steps to execute a basic a gremlin query.
- From the IBM Graph dashboard, click Query.
- Execute the following gremlin query.
def gt = graph.traversal();

gt.V().has("name", "Jill Doe").out("bought_ticket").values("name")
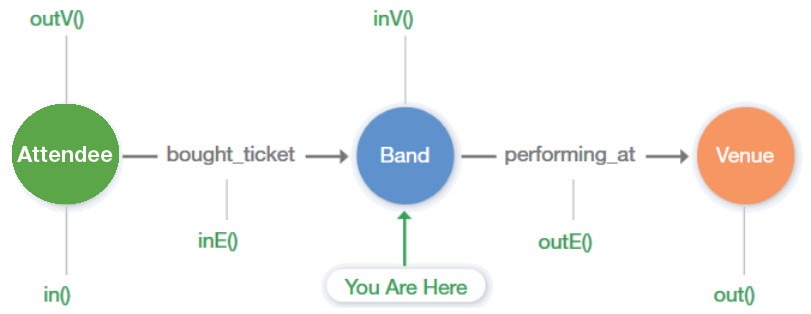
This query handles a very simple scenario. The following table and diagram outline the process this query follows.
- The traversal uses "has" to first filter out the name of the attendee vertex, Jill Doe.
- Then, walks "out" to the band vertex.
- Then returns the "name" of any bands Jill Doe has bought tickets to see. The response is the band Quarters.
 Back to top
Load the Sample Dataset
Graph’s power will become immediately apparent when you're able to walk multiple steps into your graph. In order to truly understand that power, you'll need to load a more robust version of the dataset which includes more attendees, bands, and venues. You could do that by extending the schema and then bulk loading the data using either the bulkload endpoint or the Load panel in the IBM Graph dashboard. As an alternative, you can load the sample data set from the IBM Graph dashboard.
Follow these steps to load the sample dataset.
- From the IBM Graph dashboard, click Samples.
- On the Samples slide-out panel, next to Music Festival, click Load. The file will be added to the File Queue.
The following image illustrates the new schema for the sample dataset which includes a new vertex named venue, and two new edges named performing_at and advertised_to.
Back to top
Chain Steps
Gremlin is a query language that revolves around steps, meaning that it can pass information from one Gremlin process to another in a single query. You can chain together various steps in order to traverse your graph.
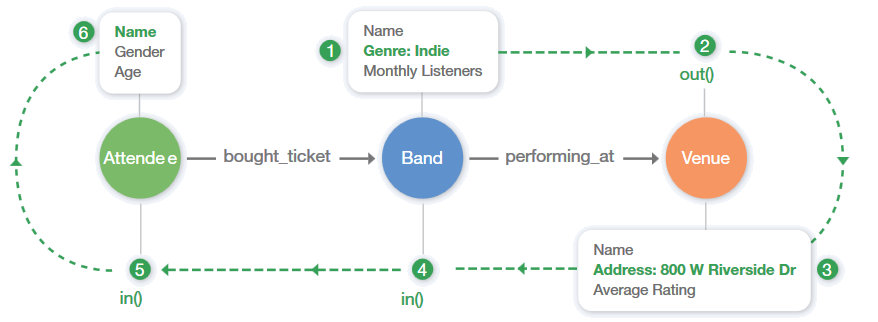
- Execute this query in the Query Builder. This traversal shows you the names of any attendees who purchased a ticket to an Indie genre performance at a specified venue.
def gt = graph.traversal();

gt.V().has("genre", "indie").out("performing_at").has("address",  "800 W. Riverside Dr.").in("performing_at").in("bought_ticket").values("name")
The following table and diagram outline the process this query follows:
- This query first finds any band that falls under the Indie genre.
- Then walks out to venues that are showing Indie performances.
- More specifically, it filters the venues down using one more criteria: the address.
- Next, it needs to make it back to the attendee vertex, so it steps back to the band vertex.
- Then takes one more step back to an attendee vertex.
- Lastly, it returns the names of all attendees that have purchased a ticket to an Indie performance at 800 W Riverside Dr.
That’s the beauty of chaining pipes with Gremlin. We can effortlessly break down the traversal process into a step-by-step format that helps facilitate a clearer understanding of your dataset.
Back to topMake Recommendations
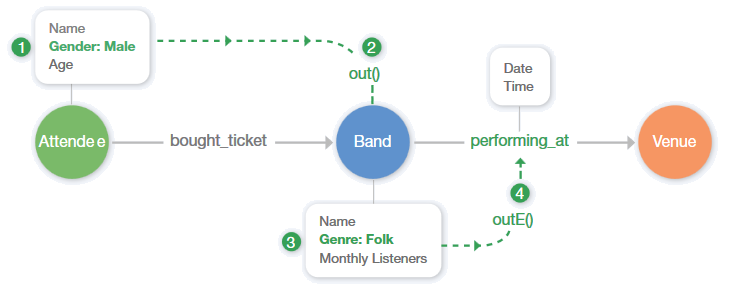
Queries like the previous example are useful for returning clusters of filtered-down data, but graph truly shines when your queries lead to learning something new about your dataset. For example, to recommend a performance that a Folk genre music fan would want to see. There are plenty of metrics that you could use to figure out what these fans might like. One very simple metric is finding what other folk performances are going on at the festival.
- Execute this query in the Query Builder.
def gt = graph.traversal();

gt.V().has("gender","male").out("bought_ticket").has("genre", "Folk").outE("performing_at")
The following table and diagram outline the process this query follows:
- This query first finds every male attendee.
- Then discovers which of them have purchased a ticket to see a band performance.
- And then more specifically to a folk band performance.
- Finally, the query returns each folk performance that this sub-population has purchased tickets for.
Recommendation engines can become far more robust than this query, but it’s worth seeing a simplified example to understand the power of traversals.
That’s it for Getting Started with IBM Graph! We’ve covered the basic concepts and components that establish the foundation of the service. To further develop your technical understanding, check out the full documentation. Otherwise, welcome to IBM Graph!
Back to top